 State credit unions now hold more than $1 trillion in assets, representing more than half of all assets held across the credit union system, the latest figures from NCUA show.
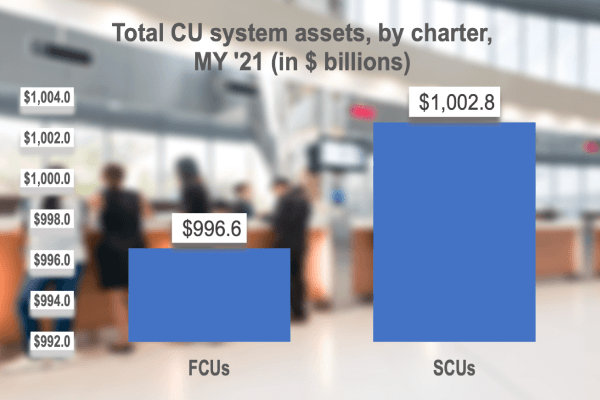
Mid-year 2021 numbers released this week by the agency (and numbers compiled by NASCUS for privately insured credit unions from American Share Insurance (ASI)) show that the state system holds $1.003 trillion in combined assets (both federally insured, state chartered CUs (FISCUs) and privately insured credit unions (PICUs)). Federal credit unions hold just under the trillion-dollar mark, at $997 billion.
That brings the combined total of assets for all credit unions to just under $2 trillion ($1.99 trillion). As of mid-year, SCUs held 50.2% of total assets, with FCUs at 49.8%.
The numbers also show state credit unions expanded their asset totals slightly faster than federals during the first half of the year, at a rate of 7.35% (compared to 7.02% for FCUs). In memberships, however, the FCUs added more at a faster rate, adding 1.8 million (up 2.77% from year-end). SCUs added just under 1.1 million members (for a 1.79% growth rate). Total memberships at credit unions are now more than 127 million, according to the compiled statistics.
“The trillion-asset mark is a milestone for the state credit union system,” NASCUS President and CEO Lucy Ito said. “It was only in the last decade that the credit union system as a whole reached $1 trillion in assets. This latest achievement is an indication of how consumers have turned to the credit union system – and particularly state credit unions – during these latest days of economic challenges, and a search by savers and borrowers for security and service.”
The NCUA mid-year numbers also show that credit unions saw their net income rise by more than 77% in the first half of 2021, compared to year-end 2020, expanding to $21.3 billion over the six-month period.
Yet, even though credit unions saw growth in assets, memberships and net income, the overall net worth ratio for the credit union industry in the first half of the year actually declined, the NCUA numbers show. At mid-year, the credit union net worth ratio (which is the primary indicator of credit union safety and soundness) fell to 10.17%, down 150 basis points from year-end (when it stood at 10.32%).
However, the net interest margin at credit unions (which is gauged by comparing the net interest income a credit union earns on loans to the interest it pays savers, a key indicator of profitability) remained steady during the first half of the year, at 2.57% of average assets (the same as at the end of the first quarter). That’s the first quarter in the last five that the ratio has not declined. However, the ratio for the second quarter is also tied for the lowest point it has been in the last five years (comparing second quarter figures only).
LINK:
Credit Unions’ Net Income, Insured Shares and Deposits Rise in Second Quarter