The Federal Reserve’s mission and regional structure ask that it always work to better understand local and regional economic activity.
This requires gauging the economic impact of localized events, including natural disasters. Despite the economic significance of natural disasters—flowing often from their human toll—there are currently no publicly available data on the damages they cause in the United States at the county level.
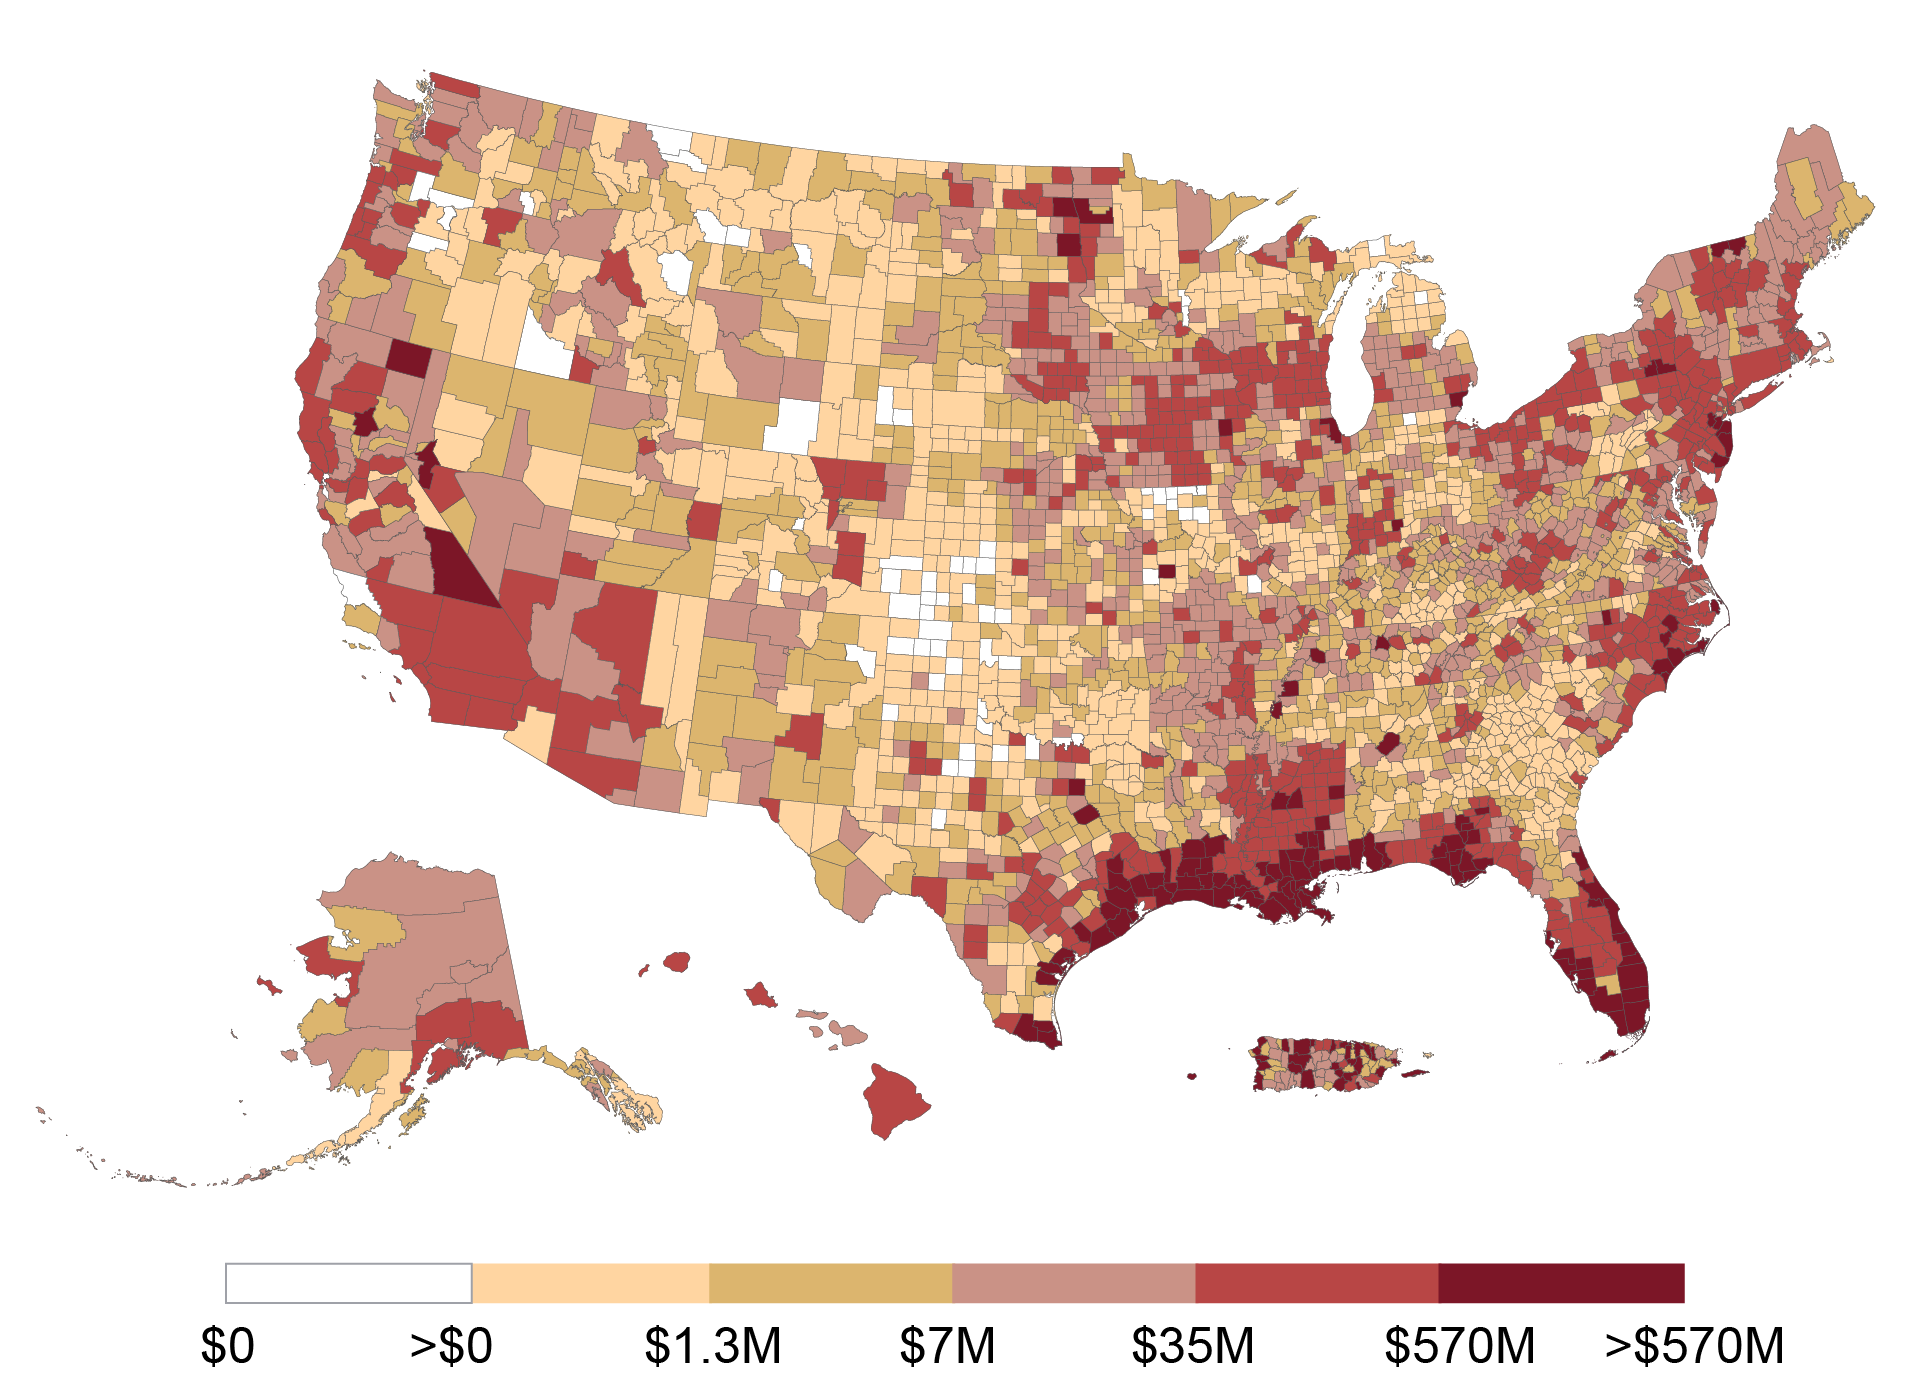
Damages from Floods, Hurricanes, and Coastal Disasters Sources: NOAA; U.S. Census Bureau. Notes: This heat map shows total cumulative county-level damages from floods, hurricanes, and coastal disasters between 1996 and 2023. Coastal disasters include coastal flooding, storm surge/tide, high surf, astronomical low tide, and rip current. Damages are inflation-adjusted to December 2023 dollars using the CPI.
This post, based on a related Staff Report, introduces Losses from Natural Disasters: the first publicly available comprehensive dataset on county-level damages, injuries, and fatalities from natural disasters in the U.S. This dataset—also accessible through an interactive map—can be easily matched with data on economic activity and banking networks to help businesses and households prepare for and respond to natural disasters. Further, because the dataset allows for county-level analysis, it can help policymakers understand local economic conditions following natural disasters.
A Preview of the Data
The Losses from Natural Disasters dataset currently covers the period from January 1996 to December 2023 and will be updated twice a year. For each natural disaster, the data show county-level property and crop damages, injuries, and fatalities, as well as the start and end dates of each weather event. Disasters are grouped into twelve categories. The two maps above show, for example, the cumulative damages from “floods, hurricanes, and coastal disasters” (top) and “wildfires” (bottom) from January 1996 to December 2023. The damages displayed are inflation-adjusted to December 2023 dollars (the Losses from Natural Disasters dataset also reports nominal amounts). These maps document that Florida, the Southeast, and parts of the East Coast have suffered the most from floods, hurricanes, and coastal disasters, while the West has been particularly affected by wildfires.
Courtesy of Matteo Crosignani and Martin Hiti, Federal Reserve Bank of New York