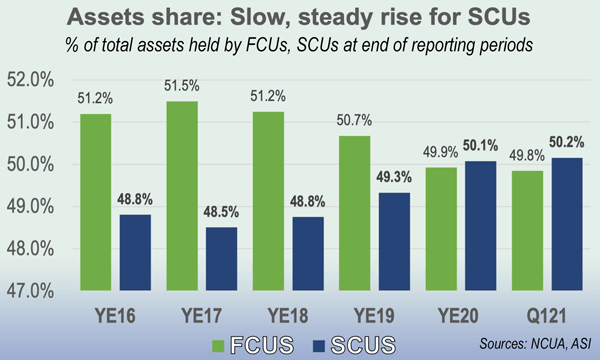
(Dec. 10, 2021) State-chartered credit unions maintained their hold on a slight majority of all credit union assets over the third quarter 2021, with about 50.2% of the total, according to numbers released this week by NCUA and compiled by NASCUS.
The latest numbers make the fourth quarter in a row (since the fourth quarter of 2020) that state credit unions have held the most assets. The results are derived from NCUA third-quarter call reports (for federally insured credit unions) and American Share Insurance, Inc., for privately insured CUs (compiled by NASCUS).
Additionally, state and federal credit unions crossed a new threshold in the third quarter: both exceeded $1 trillion in assets for the first time, for a total of $2.04 trillion combined ($1.02 trillion for states, which includes both federally insured and privately insured), and $1.01 trillion for FCUs.
NASCUS President and CEO Lucy Ito said the third quarter results demonstrate the resilience of state credit unions, their members’ trust in their service and viability, and careful and reasonable supervision by state authorities. “The financial impact of the pandemic caused many members to save their money, particularly that provided by the government to maintain economic activity,” Ito said. “They turned to their credit unions as the repository of their funds, because they knew it was a safe, sound, convenient and responsible shelter for them.”
Overall, assets at both state and federal credit unions have grown by about 9% since the end of last year, reflecting the influx of savings by members.
Meanwhile, memberships at credit unions exceeded 130 million for the first time, with 48.1% held by SCUs and 51.9% by FCUs.
The number of credit unions fell again by the end of the third quarter (continuing a long-term trend driven by consolidation of the industry), with 5,096 total (38.7% SCUs and 61.3% FCUs).
Financially, credit unions posted a solid performance in the third quarter, according to the NCUA numbers for federally insured credit unions (both SCUs and FCUs). That is:
- An aggregate net worth ratio (net worth as a percentage of total assets) of 10.23% at the end of the third quarter, up from 10.16% at the end of the previous quarter. Compared to a year earlier (third-quarter 2020) when the ratio was 10.44%, the ratio had declined. However, it bottomed out in the first quarter of the year at 10.02% and has been climbing, quarter by quarter, since then.
- Return on average assets – a broad indicator of credit union profitability overall– was 112 basis points in the third quarter, NCUA said, the same as posted in the second quarter, but up from 65 basis points in the same period a year earlier. The median credit union return on assets in third-quarter 2021, NCUA noted, was 56 bp, up from 42 bp a year earlier
- Net interest margin was $50 billion, or 2.59% of average assets – up from $48.1 billion, but down as a percentage of average assets, which was 2.87%.
LINK:
Credit Unions See Continued Share and Deposit Growth in Third Quarter
 State credit unions now hold more than $1 trillion in assets, representing more than half of all assets held across the credit union system, the latest figures from NCUA show.
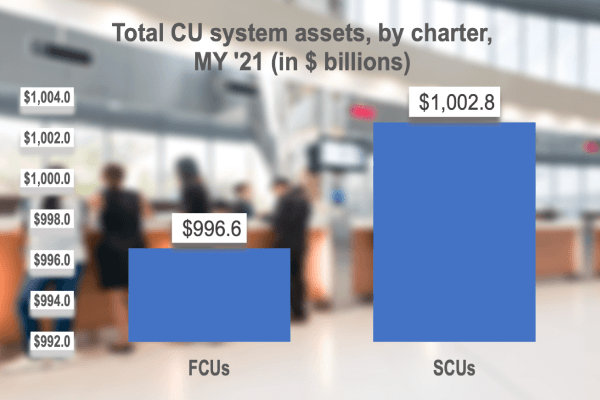
Mid-year 2021 numbers released this week by the agency (and numbers compiled by NASCUS for privately insured credit unions from American Share Insurance (ASI)) show that the state system holds $1.003 trillion in combined assets (both federally insured, state chartered CUs (FISCUs) and privately insured credit unions (PICUs)). Federal credit unions hold just under the trillion-dollar mark, at $997 billion.
That brings the combined total of assets for all credit unions to just under $2 trillion ($1.99 trillion). As of mid-year, SCUs held 50.2% of total assets, with FCUs at 49.8%.
The numbers also show state credit unions expanded their asset totals slightly faster than federals during the first half of the year, at a rate of 7.35% (compared to 7.02% for FCUs). In memberships, however, the FCUs added more at a faster rate, adding 1.8 million (up 2.77% from year-end). SCUs added just under 1.1 million members (for a 1.79% growth rate). Total memberships at credit unions are now more than 127 million, according to the compiled statistics.
“The trillion-asset mark is a milestone for the state credit union system,” NASCUS President and CEO Lucy Ito said. “It was only in the last decade that the credit union system as a whole reached $1 trillion in assets. This latest achievement is an indication of how consumers have turned to the credit union system – and particularly state credit unions – during these latest days of economic challenges, and a search by savers and borrowers for security and service.”
The NCUA mid-year numbers also show that credit unions saw their net income rise by more than 77% in the first half of 2021, compared to year-end 2020, expanding to $21.3 billion over the six-month period.
Yet, even though credit unions saw growth in assets, memberships and net income, the overall net worth ratio for the credit union industry in the first half of the year actually declined, the NCUA numbers show. At mid-year, the credit union net worth ratio (which is the primary indicator of credit union safety and soundness) fell to 10.17%, down 150 basis points from year-end (when it stood at 10.32%).
However, the net interest margin at credit unions (which is gauged by comparing the net interest income a credit union earns on loans to the interest it pays savers, a key indicator of profitability) remained steady during the first half of the year, at 2.57% of average assets (the same as at the end of the first quarter). That’s the first quarter in the last five that the ratio has not declined. However, the ratio for the second quarter is also tied for the lowest point it has been in the last five years (comparing second quarter figures only).
LINK:
Credit Unions’ Net Income, Insured Shares and Deposits Rise in Second Quarter
 (June 11, 2021) Credit union assets mushroomed to a total of just under $2 trillion in the first quarter of the year – and state-chartered credit unions kept pace with the growth, maintaining a slight edge over federals in the share of total assets held as of March 31, according to numbers released by NCUA, and compiled by NASCUS, late last week.
According to first-quarter credit union statistics culled from first quarter call reports, the nation’s 2,007 state credit unions (federally and privately insured) held 50.2% of total assets, with the 3,167 federals holding the balance. Growth of assets in the first quarter slightly favored state credit unions, which advanced their holdings by 5.85%; FCUs grew by 5.52%. Membership at the state credit unions advanced by just over 500,000 (0.83%); FCUs saw memberships grow by 900,000 (1.39%). Total membership for credit unions was 125.8 million (FCUs have the edge here, with 51.7% of all members).
As in past quarters, most of the growth in assets was centered on the largest of credit unions: those with at least $1 billion (395 credit unions). Those CUs held more than $1.4 trillion in assets and 72% of all assets in credit unions. Membership grew by 10% and net worth increased by 13.7%, according to NCUA. (The 293 credit unions with more than $500 million but under $1 billion in assets held about 10% of total assets and also saw increases in their lending, memberships and net worth).
Those results are in stark contrast with smaller credit unions (those under $500 million in assets): according to NCUA, loans, membership and net worth among those credit unions – which make up 92% of all credit unions, but hold only about 17% of all assets — declined in the first quarter, following a trend of the last several years.
NASCUS President and CEO Lucy Ito affirmed that the inflow of savings from stimulus payments and other sources was a key factor in driving up assets at credit unions that saw growth. But she also praised the management of state credit unions for ensuring their members have a haven for their savings, and that the members understand the safety and value a credit union offers.
“The numbers make it clear that credit union members recognize that their state-chartered institutions are strong, safe and resilient institutions that watch out for their members’ interests,” she said.
But she also acknowledged the struggle that smaller credit unions face in today’s environment. “State supervisory authorities are committed to doing whatever they can, in concert with safety and soundness, to give smaller credit unions their best chance to thrive,” Ito said. “Small credit unions play a key role in the lives of their members, and the state system wants that role to continue.”
Other first quarter results for federally insured credit unions (state and federal) reported by NCUA showed:
- The return on average assets for federally insured credit unions was 104 basis points in the first quarter of 2021, up from 52 basis points in the first quarter of 2020.
- Net income totaled $19.7 billion at an annual rate, up $11.3 billion (134.9%) from the same period a year ago.
- The net interest margin was $48.7 billion, 2.57% of average assets.
- Delinquency and net charge-off rates were both down, compared to a year ago: the former was 46 basis points (down 17 points from last year); the latter (as the net charge-off ratio) was 35 bp (down from 58 bp in the first quarter of 2020).
LINK:
Rising Net Income, Elevated Insured Share Growth Reported in First Quarter of 2021
(Dec. 11, 2020) State credit unions maintained their hold of half of all credit union assets during the third quarter, according to the latest quarterly financial results released by NCUA late last week, and other results compiled by NASCUS.
However: asset growth for all charters of credit unions – state (federally and privately insured) and federal – dropped off considerably during the third quarter.
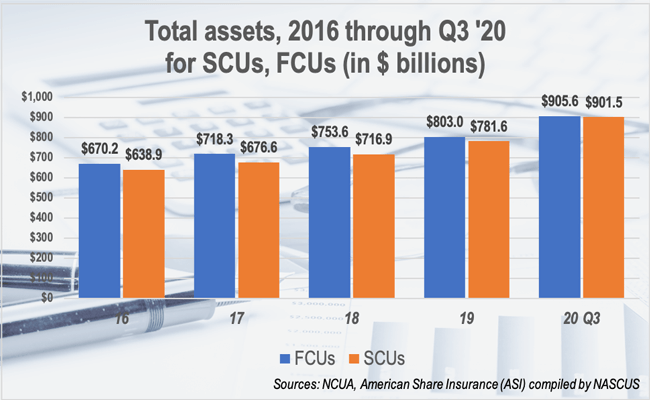
According to the third-quarter results from NCUA (and results from privately insured credit unions collected by private insurer American Share Insurance (ASI) and compiled by NASCUS), state credit unions (SCUs, federally and privately insured) held $901.5 billion in total assets, up 15.3% since the beginning of the year. That accounts for 49.9% of all credit union assets. Federal credit unions, (FCUs) meanwhile, held $905.6 billion in assets, up 12.8% from the year’s start – and accounting for 50.1% of all assets. There were 2,027 SCUs, and 3,213 FCUs, at the end of the third quarter.
Much of the asset growth, however, occurred in the first half of the year – particularly the second quarter – and asset growth slowed in the third quarter. For example, assets for SCUs expanded from year-end 2019 by 12.6% in the first six months of the year (about 8.4% in the second quarter), but only by about 2.7% from the second to the third quarter. FCUs saw a similar growth pattern, with asset growth at mid-year of 10.9% from the end of 2019, but only 1.8% from the second to third quarter.
An influx of savings spurred by stimulus checks to individuals (which were largely recorded in the second quarter), and by payments for enhanced unemployment insurance (UI) and through the Paycheck Protection Program (PPP) payments to workers, is attributed to the asset growth. There were no additional stimulus checks in the third quarter, and enhanced UI came to an end during the quarter.
“Although the 2,037 state-chartered credit unions make up only about 39% of all credit unions across the nation, they have an outsize influence on the lives of their nearly 60 million members who trust these institutions to safeguard their savings and provide them with needed financial services,” said NASCUS President and CEO Lucy Ito, referring to the more than 48% of all credit union members who belong to SCUs.
Other results from the third quarter results show:
- SCU memberships have grown by 3.3% since the beginning the year (1.4% during the third quarter, adding more than 810,000 memberships). FCUs have expanded their memberships by 2.2% since year-end 2019, and less than 1% in the third quarter for 600,000 memberships. Since the end of last year, more than 3.3 million memberships have been added, for a total of 125 million.
- The number of credit unions continued to drop through the first three quarters of the year, with 5,240 reporting their financial results at the end of the third quarter – 107 fewer than at the end of 2019. Of those, 37 were SCUs and 70 FCUs.
LINK:
NCUA Releases Q3 2020 Credit Union System Performance Data