NCUA Releases Second Quarter Credit Union System Performance Data
 Sept. 7, 2022 — According to the latest financial performance data released today by the National Credit Union Administration, total loans outstanding in federally insured credit unions increased $194 billion, or 16.2 percent, over the year ending in the second quarter of 2022, to $1.39 trillion. This represents the largest year over year growth in loans outstanding in at least two decades. Credit union loan balances also rose in all major categories, compared with the second quarter of 2021.
During the same period, total assets climbed by $159 billion, or 8.1 percent, to $2.14 trillion. Insured shares and deposits also grew $110 billion, or 7.0 percent, to $1.69 trillion, from one year earlier.
“These latest quarterly industry performance results point to a growing and overall healthy credit union system that’s facilitating the ability of families to achieve their financial goals,” said NCUA Chairman Todd M. Harper. “But, at the same time, we have also seen declines in the system’s net income and returns on average assets, rapidly rising interest rates and continued inflationary pressures. And, we have identified growing liquidity concerns within the system. Therefore, credit unions of all types and sizes must remain diligent in managing safety and soundness as we continue to navigate the challenging economic environment ahead of us.”
The NCUA’s Quarterly Credit Union Data Summary provides an overview of the financial performance of federally insured credit unions based on information reported to the agency in the second quarter of 2022. As of June 30, 2022, there were 4,853 federally insured credit unions with 132.6 million members.
Additional highlights from the NCUA’s Credit Union Data Summary(opens new window) for the second quarter of 2022 include:
- Net income for federally insured credit unions in the first half of 2022 totaled $18.0 billion at an annual rate, down $3.3 billion, or 15.4 percent, from the first half of 2021.
- Interest income rose $5.7 billion, or 9.8 percent, over the year to $63.6 billion. Non-interest income fell $3.1 billion, or 11.7 percent, to $23.6 billion, largely due to a drop in other income.
- The credit union system’s provision for loan and lease losses or credit loss expense increased $2.1 billion, or 154.8 percent, to $3.4 billion at an annual rate in the first half of 2022.
- The delinquency rate at federally insured credit unions was 48 basis points in the second quarter of 2022, up 2 basis points compared with the second quarter of 2021.
- Credit union shares and deposits rose by $139.7 billion, or 8.1 percent, over the year to $1.85 trillion in the second quarter of 2022. Regular shares increased $62.3 billion, or 9.9 percent, to $689.0 billion. Other deposits increased $37.1 billion, or 5.0 percent, to $782.5 billion, led by money market accounts, which grew $52.2 billion, or 13.9 percent, over the year.
- The credit union system’s net worth increased by $21.6 billion, or 10.8 percent, over the year to $222.7 billion.
- The aggregate net worth ratio — net worth as a percentage of assets — stood at 10.42 percent in the second quarter of 2022, up from 10.16 percent one year earlier.
The NCUA makes credit union system performance data available in the Credit Union Analysis section of NCUA.gov. The analysis section includes quarterly data summaries as well as detailed financial information, a graphics package illustrating financial trends in federally insured credit unions, and a spreadsheet listing all federally insured credit unions as of June 30, 2022, including key metrics.
(Dec. 10, 2021) State-chartered credit unions maintained their hold on a slight majority of all credit union assets over the third quarter 2021, with about 50.2% of the total, according to numbers released this week by NCUA and compiled by NASCUS.
The latest numbers make the fourth quarter in a row (since the fourth quarter of 2020) that state credit unions have held the most assets. The results are derived from NCUA third-quarter call reports (for federally insured credit unions) and American Share Insurance, Inc., for privately insured CUs (compiled by NASCUS).
Additionally, state and federal credit unions crossed a new threshold in the third quarter: both exceeded $1 trillion in assets for the first time, for a total of $2.04 trillion combined ($1.02 trillion for states, which includes both federally insured and privately insured), and $1.01 trillion for FCUs.
NASCUS President and CEO Lucy Ito said the third quarter results demonstrate the resilience of state credit unions, their members’ trust in their service and viability, and careful and reasonable supervision by state authorities. “The financial impact of the pandemic caused many members to save their money, particularly that provided by the government to maintain economic activity,” Ito said. “They turned to their credit unions as the repository of their funds, because they knew it was a safe, sound, convenient and responsible shelter for them.”
Overall, assets at both state and federal credit unions have grown by about 9% since the end of last year, reflecting the influx of savings by members.
Meanwhile, memberships at credit unions exceeded 130 million for the first time, with 48.1% held by SCUs and 51.9% by FCUs.
The number of credit unions fell again by the end of the third quarter (continuing a long-term trend driven by consolidation of the industry), with 5,096 total (38.7% SCUs and 61.3% FCUs).
Financially, credit unions posted a solid performance in the third quarter, according to the NCUA numbers for federally insured credit unions (both SCUs and FCUs). That is:
- An aggregate net worth ratio (net worth as a percentage of total assets) of 10.23% at the end of the third quarter, up from 10.16% at the end of the previous quarter. Compared to a year earlier (third-quarter 2020) when the ratio was 10.44%, the ratio had declined. However, it bottomed out in the first quarter of the year at 10.02% and has been climbing, quarter by quarter, since then.
- Return on average assets – a broad indicator of credit union profitability overall– was 112 basis points in the third quarter, NCUA said, the same as posted in the second quarter, but up from 65 basis points in the same period a year earlier. The median credit union return on assets in third-quarter 2021, NCUA noted, was 56 bp, up from 42 bp a year earlier
- Net interest margin was $50 billion, or 2.59% of average assets – up from $48.1 billion, but down as a percentage of average assets, which was 2.87%.
LINK:
Credit Unions See Continued Share and Deposit Growth in Third Quarter
(Sept. 24, 2021) Savings expanded at a slightly quicker pace at state-chartered credit unions than at federal credit unions in the first half of the year, while lending at federals moved ahead slightly faster, according to additional numbers compiled by NASCUS for state and federally chartered credit unions.
Using mid-year call report data provided by NCUA (for federally insured credit unions) and by American Share Insurance (ASI, for privately insured credit unions), NASCUS found that savings at all state-chartered credit unions advanced by $66.3 billion in the first six months of 2021, up 8.18% to a total of $877.2 billion. At FCUs, according to the mid-year data, savings advanced by $62.2 billion, up 7.82% to $857.1 billion.
It was a flip-flop for loans, however, with states just behind the federals. According to the data, all SCUs added $15.2 billion in loans by June 30, 2021 – up 2.57% to $606.8 billion. FCUs ran their loan totals to $599 billion at mid-year – an increase of 2.69% (or $15.7 billion).
Still, in both cases, SCUs hold slight edge in market share of both loans and savings, with 50.3% and 50.6%, respectively
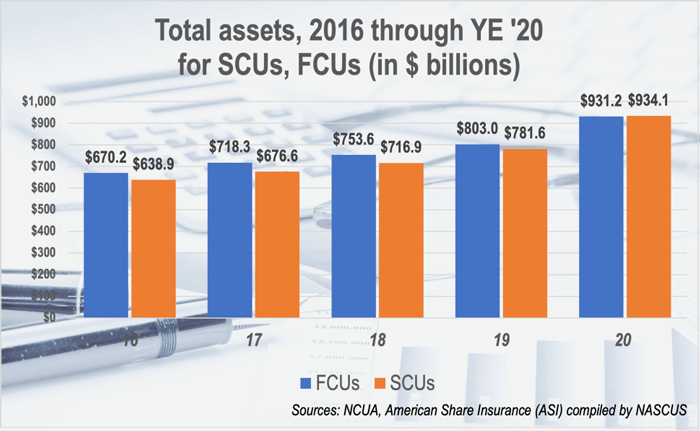
(March 5, 2021) After inching closer and closer for years, the total amount of assets held in state-chartered credit unions has exceeded that of federally chartered credit unions, with state charters now holding slightly more than 50%, according to numbers released by NCUA and compiled by NASCUS this week.
The numbers, gleaned from year-end call reports for both federal- and state-chartered credit unions (including federally and privately insured institutions), show state-chartered credit unions with $934.1 billion in assets, compared to $931.2 billion for federals. Overall assets held by credit unions are now approaching $2 trillion ($1.84 trillion). (State chartered statistics are from NCUA call reports for federally insured, state-chartered credit unions, and from American Share Insurance (ASI) Inc. for privately insured credit unions.)
“Credit union members, in response to the financial impact of the coronavirus crisis, clearly decided to hold onto or build their savings over the last year, when the pandemic’s impact became fully apparent,” said NASCUS President and CEO Lucy Ito. “Clearly, those members determined that state-chartered credit unions were a safe and sound place to maintain their savings – including their stimulus payments — reflecting the confidence in state credit unions built through responsible leadership by credit union boards and management and the careful supervision of state regulators.”
Assets at state charters grew by 19.5% over the last year, compared to 15.9% for FCUs. State system credit union memberships advanced by 3.8% (to 58.6 million); FCUs saw their memberships rise by 2.8% (to 63.1 million), for a grand total of 121.7 million memberships.
The number of credit unions continued a long slope downward, with 2,020 state charters (down 44 from year-end 2019), and 3,185 FCUs (down 98 from the end of last year). There were 5,205 credit unions at the end of 2020.
In other statistics, NCUA reported for federally insured credit unions:
- Insured shares and deposits rose $242 billion, or 19.8%, in 2020 from the previous year – a big driver of the increased assets at credit unions.
- Total loans outstanding were up $55 billion, or 4.9%, from the previous year (to $1.16 trillion); the loan-to-share ratio dropped to 73.2% at the end of 2020, down from 84% at the end of 2019 (before the pandemic’s impact was apparent).
- Net income was down $2.1 billion during 2020 compared to 2019, to $12 billion. NCUA said the decline was due primarily to a jump in provisioning for loan and lease losses or credit loss expenses.
- The return on average assets (ROAA) was 70 basis points (bps) at the end of 2020 – down from 93 bp at year-end 2019. However, NCUA pointed out that the median return on average assets across all federally insured credit unions at the end of 2020 was 40bp, down 20bp from the end of the previous year.
- The return on average assets for federally insured credit unions was 70 basis points in the fourth quarter of 2020, down from 93 basis points in the fourth quarter of 2019. The median return on average assets across all federally insured credit unions was 40 basis points, down 20 basis points from the fourth quarter of 2019.
LINK:
NCUA Releases Q4 2020 Credit Union System Performance Data